


Visualization of Time Series Data
In this project I implemented a robust time-series-data visualization tool using reactjs. The tool takes a csv file as input and answers visualization queries with high efficiency. The data is represented as an n dimensional tensor where n and dimension sizes are determined by user. The program then takes different projections of that tensor to answer visualization queries.
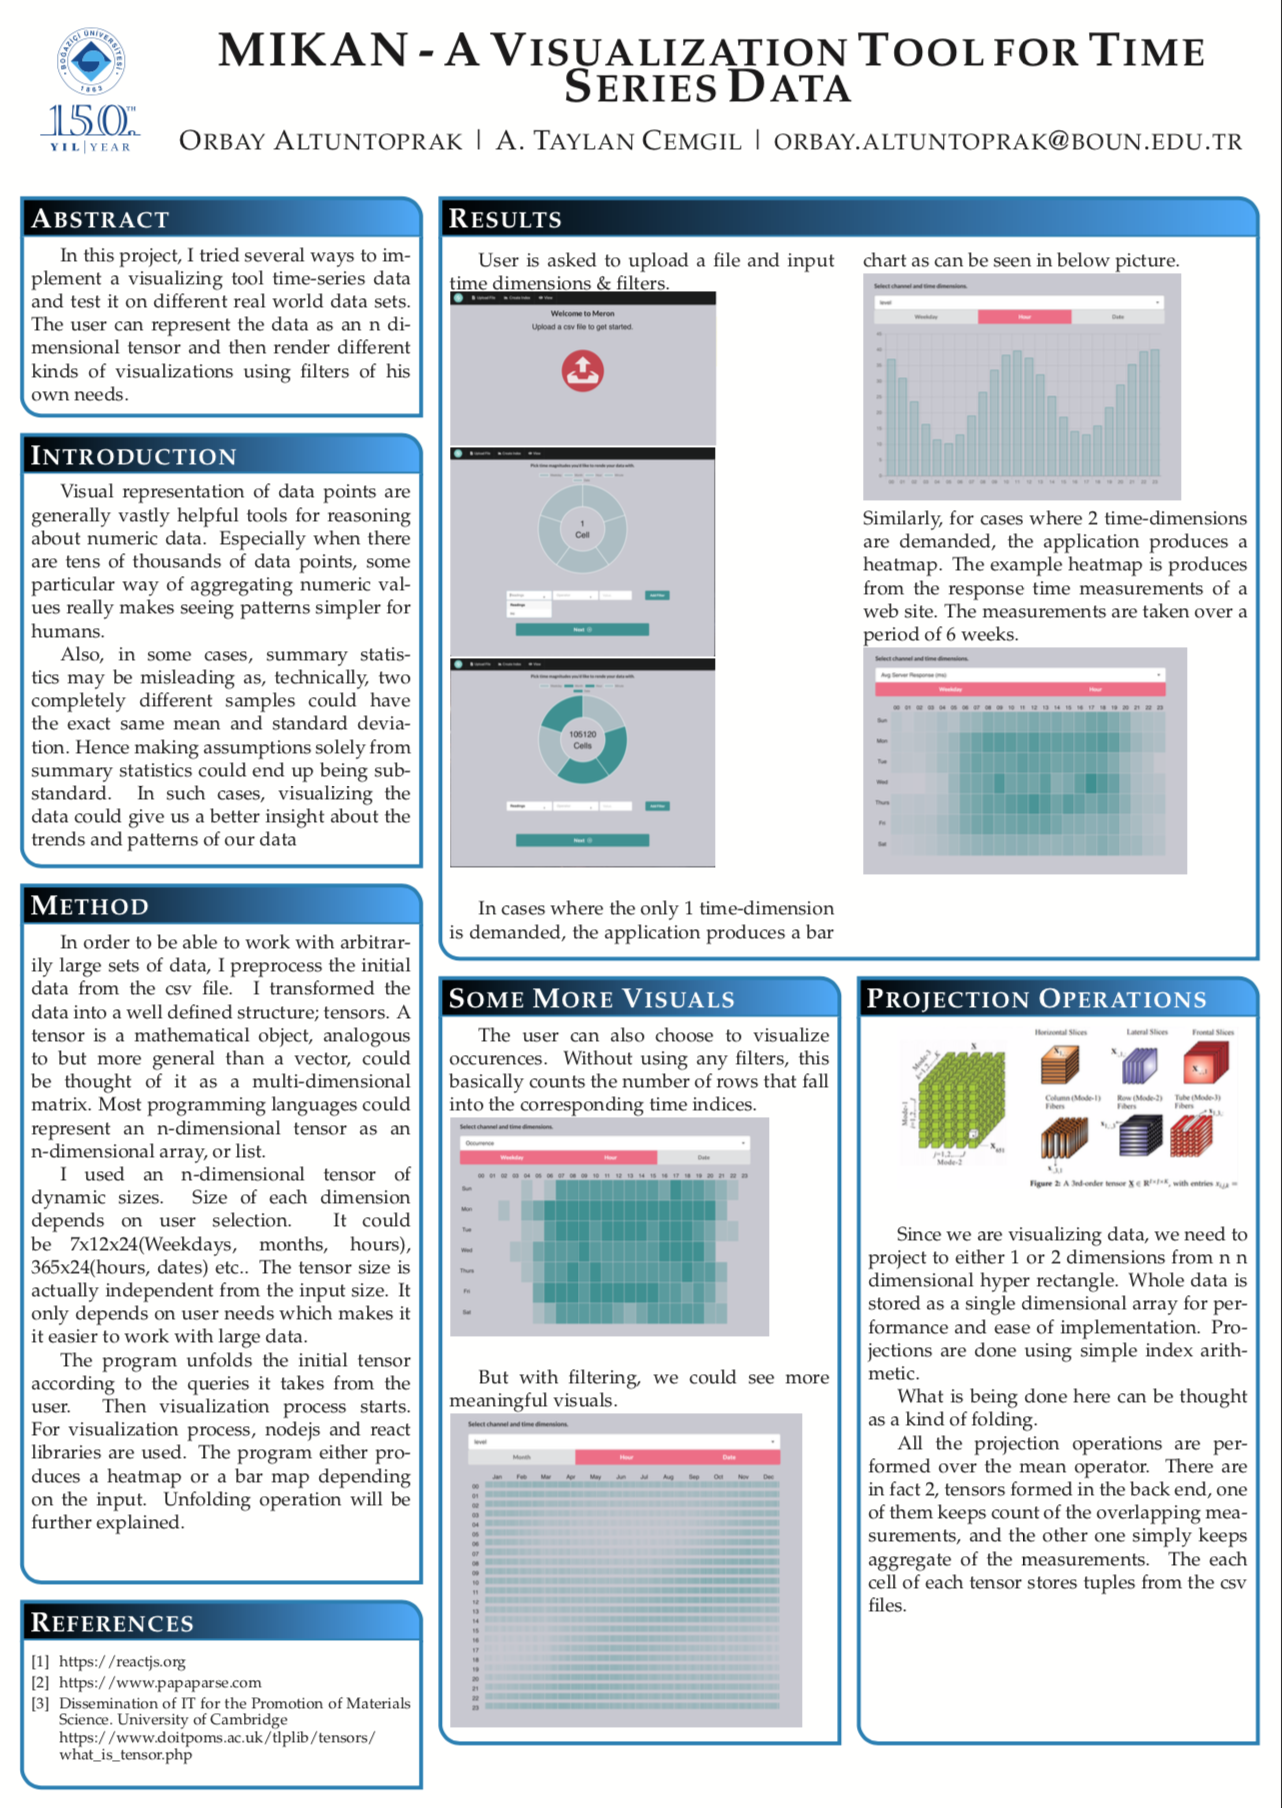
Project Poster:
Project Members:
Orbay Altuntoprak
Project Advisor:
Ali Taylan Cemgil
Project Status:
Project Year:
2018
- Fall